
IT Startup Financial Report

|
Author: Chris Miceli |

|
Dated: 2019-05-02 |

|
Uploaded: 2019-08-18 |

|
Last Edited: 6 years ago |
Abstract
This report outlines three possible financial circumstances which are likely to occur over the start-up of a IT based company given current market conditions. Each circumstance; stable growth, low or under-expected demand, and minimised initial expenses, provide effective financial management strategies to ensure scalable growth and satisfactory return on investment over a projected three year period.
Introduction
The startup, comprising a team of recent honours degree graduates, is seeking investment to occupy an identified niche in the local market. The following report will provide an introduction to the business and its operating model, as well as a breakdown of various financial projections and their expected return on investment. The forecasted circumstances aim to achieve growth and scalability through resource management and business model adaptation over a three year investment period.
Overview
Team
The team consists of three recent graduates from an Applied Computing Degree programme in Bath, who have since identified a niche in the local market for a company to address the bespoke IT product and service requirements of small businesses. The reading of a computing degree by all members provides the ability to draw upon the most recent industry-relevant knowledge and innovatively apply various technologies to fulfil client requirements.
Business Operations
The business will offer three categories of product and/or service offerings, including upfront cost products, annually contracted services and bundled combinations of the two. Annually contracted offerings are charged for the duration of the financial year, and bundled offerings consist of an upfront price followed by a service contract for the remainder of the financial year.
The company intends to offer the following:
- Standard Website Production & Maintenance
- Interactive/Commerce Website Production & Maintenance
- Networking Set-Up & Maintenance
- General IT Support & Maintenance
- IT Procurement
- IT Security & Data Protection Services
Relevant prices are provided under Appendix A. The main source of long-term income is expected to result from the annual renewal of support and maintenance contracts every April, due to the increasing number of compounding clients each year. Products which generate a one-time income operate as a feeder into the main revenue stream, as most contracts work to complement such offerings.
Investment
The startup requires a £30,000 capital investment to cover initial costs and ongoing operations until the business is self-sufficient. The following report contains three scenarios detailing how variable market and operating factors are likely to impact projected profit, loss, & return on investment over the duration of a three year investment.
Financial Analysis
Scenario A - Stable Growth
This situation classifies the most accurate and probable outcome due to justifiable sales predictions and reasonable initial & running costs in relationship to resource availability.
Investment Return
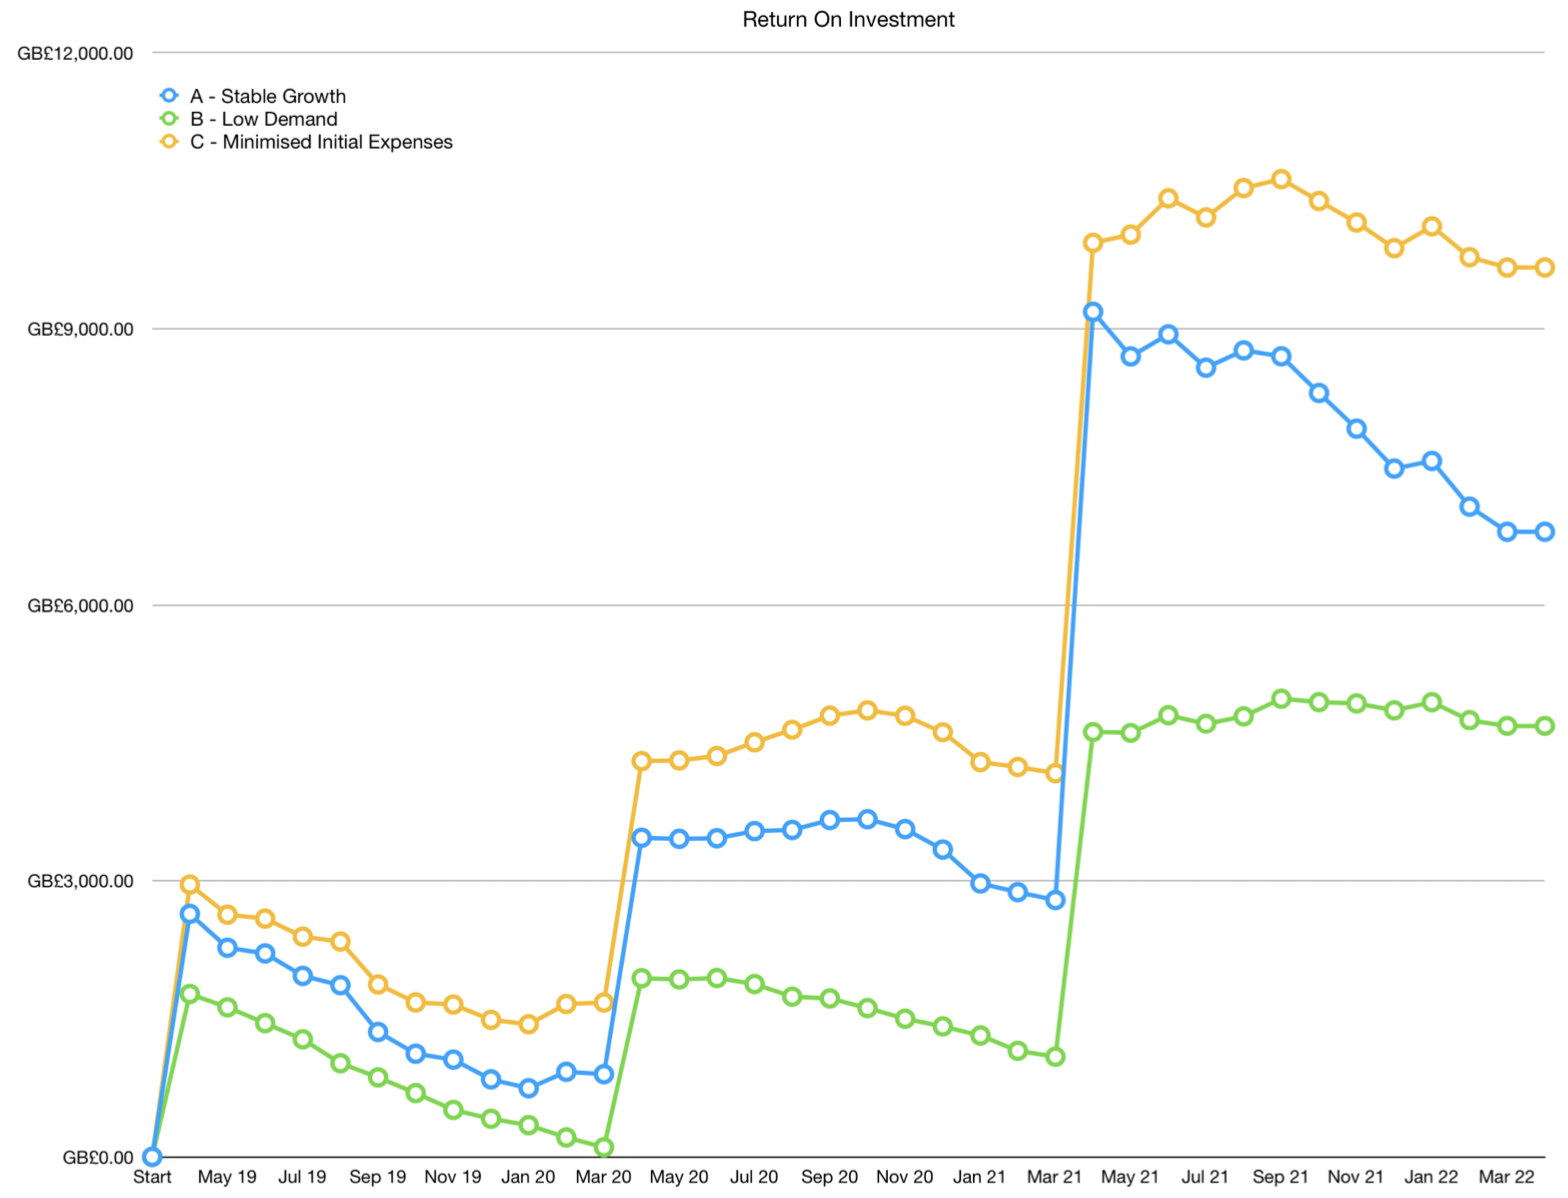
The business is projected to be self-sufficient in the second year after launch. Figures provided in Appendix B indicate a return just over £6,560 (≈21.8%) on the original investment over the three year duration.
Initial & Ongoing Costs
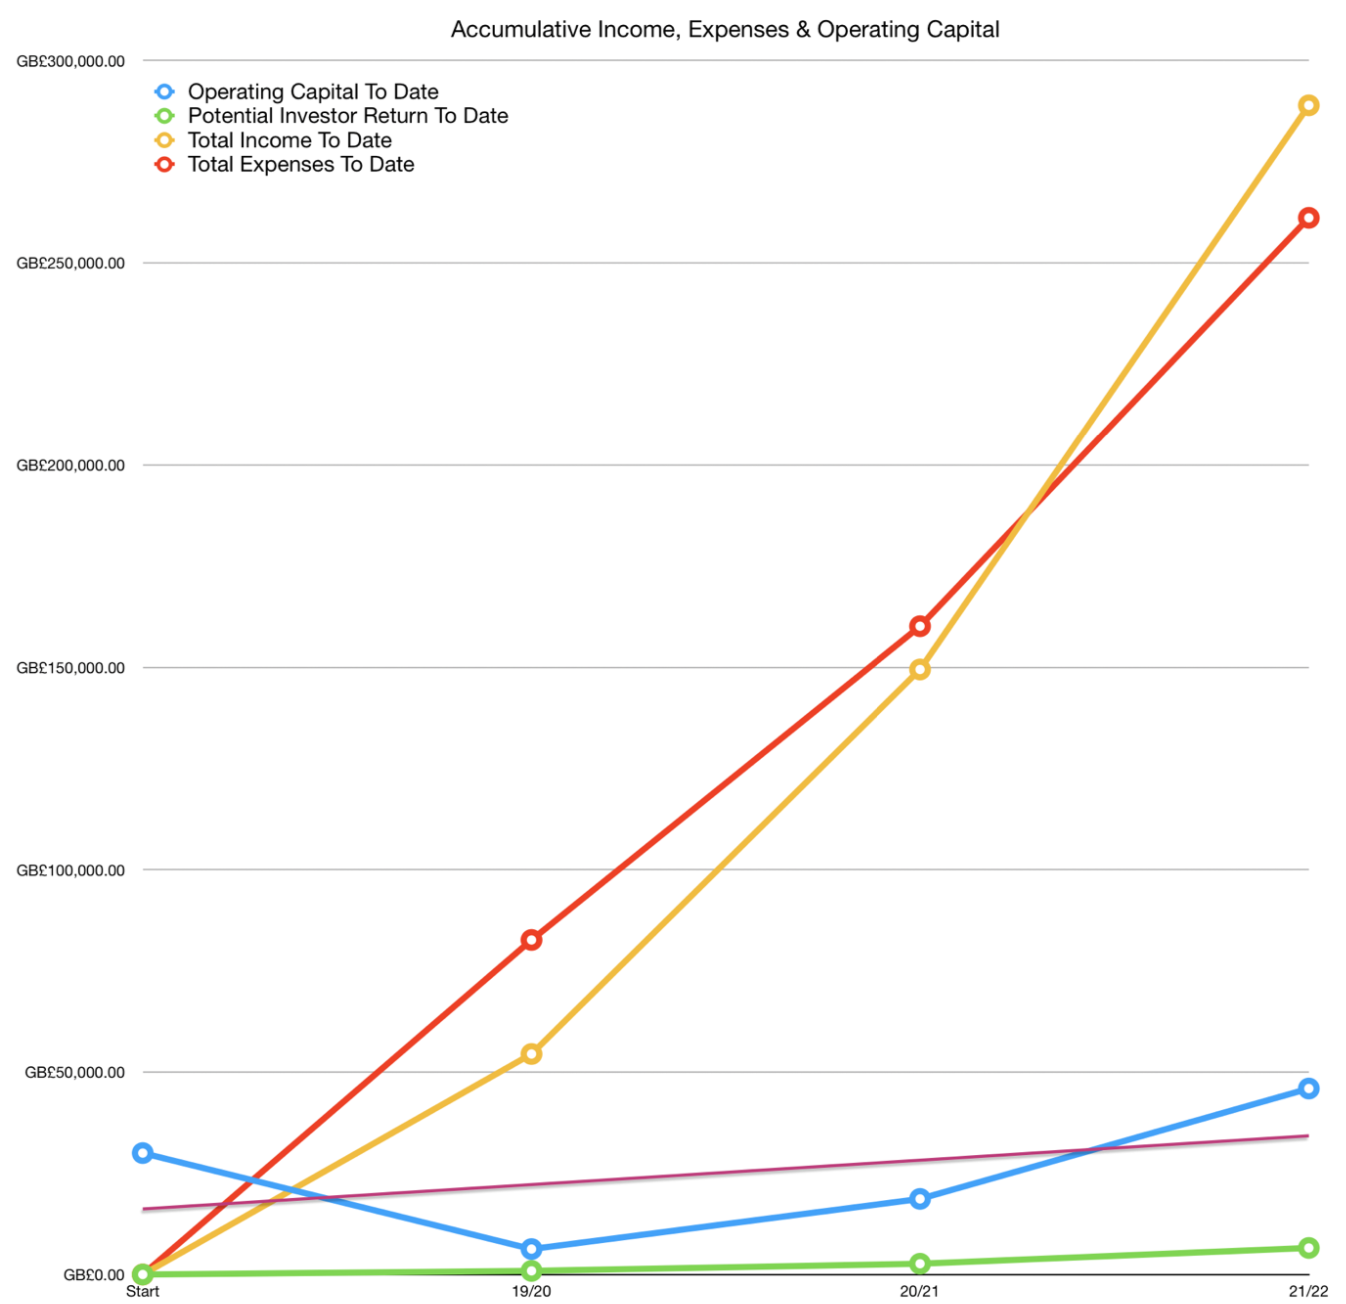
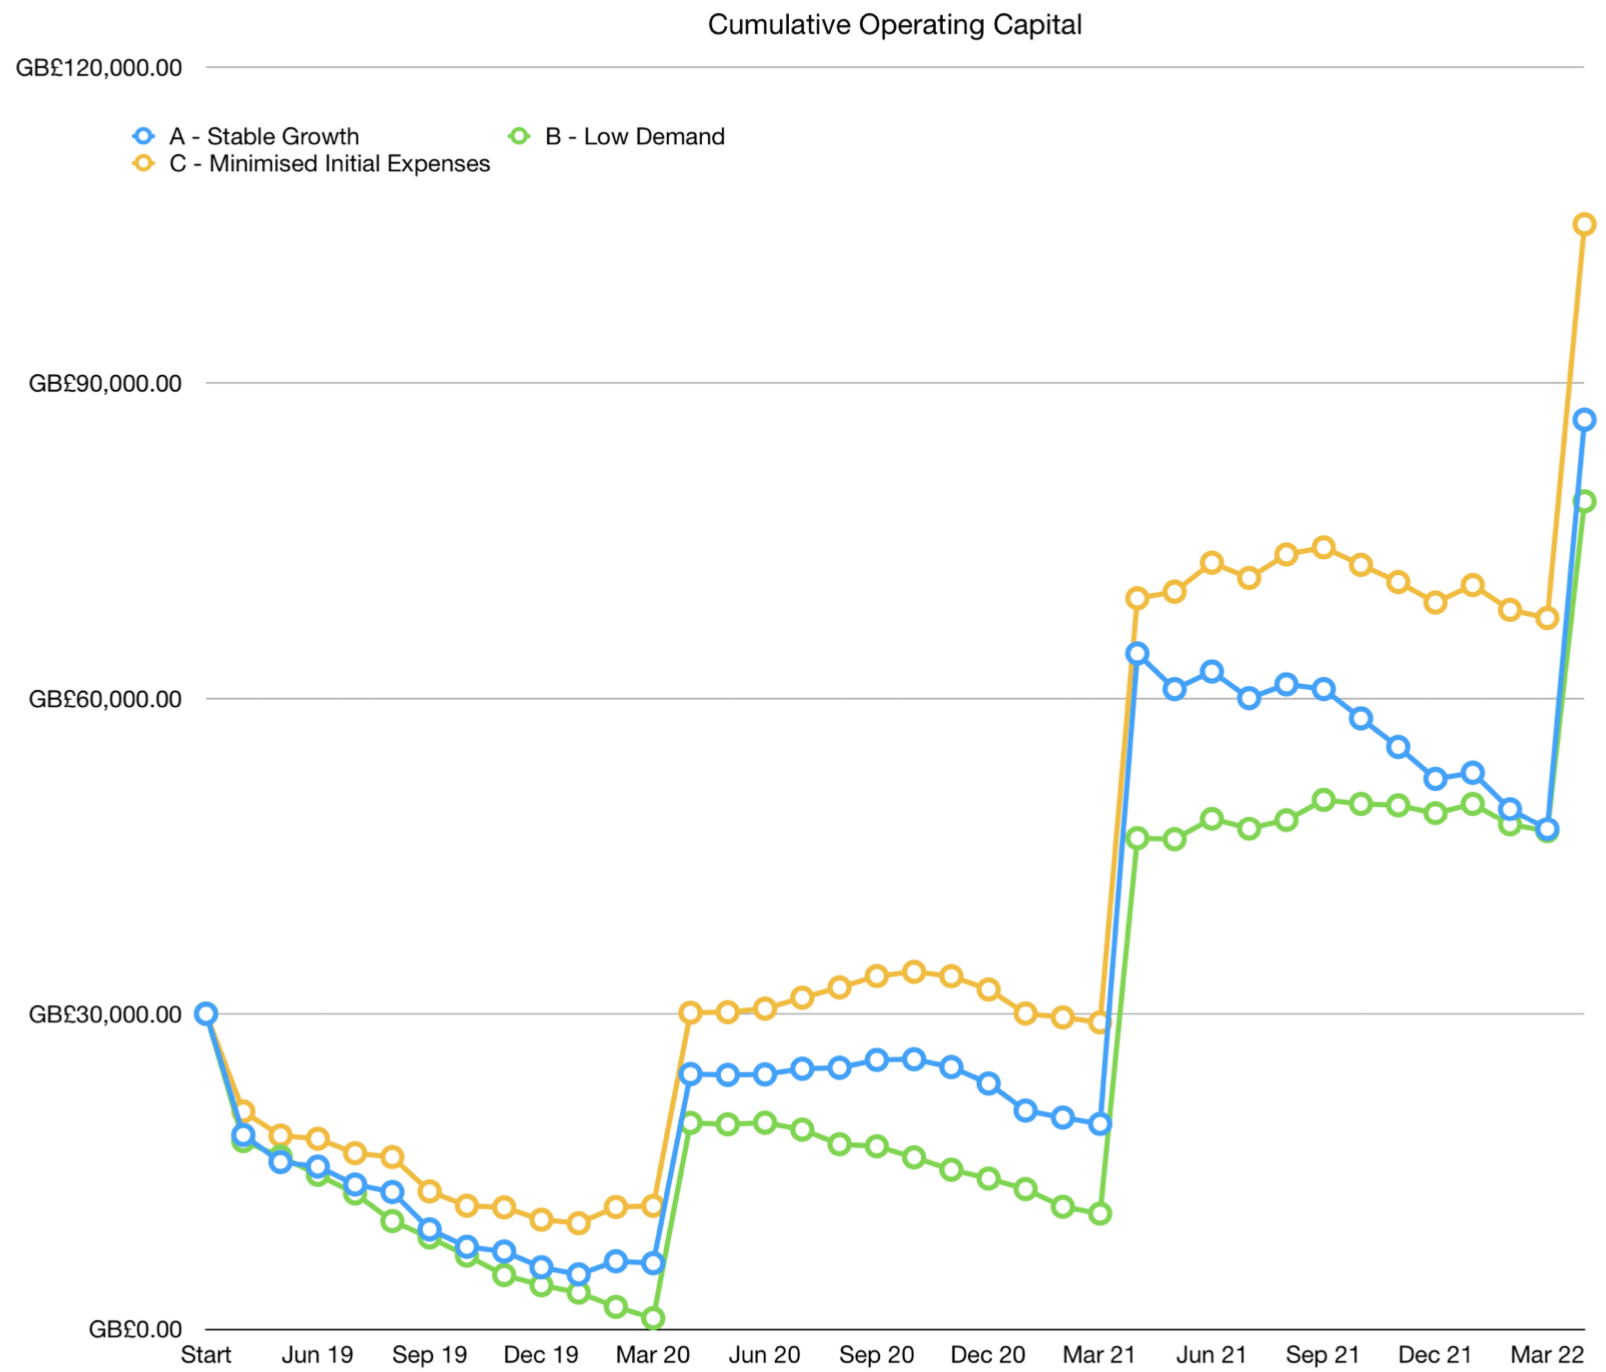
Initial costs will total around £14,000, leaving the remaining capital to finance business operations till the start of the following financial year, at which point client contracts will be renewed. Throughout the first and second year, the company is expected to be recovering startup and ongoing costs, generating relatively significant profit in the beginning of the third financial year, as graphed in Appendix C: ‘Accumulative Income, Expenses & Operating Capital’.
| Initial Costs | Ongoing Monthly Costs | |||
|
Computers |
GB£ 3,100.00 |
Rent |
GB£ 410.00 |
|
|
Furniture |
GB£ 2,200.00 |
Utilities |
GB£ 105.00 |
|
|
Printers/Scanners |
GB£ 530.00 |
Web Hosting |
GB£ 35.00 |
|
|
Cell Phones |
GB£ 1,920.00 |
Insurance |
GB£ 120.00 |
|
|
Total |
GB£ 7,750.00 |
Advertising |
GB£ 225.00 |
|
|
Software Licensing |
GB£ 190.00 |
|||
|
Salaries |
GB£ 5,250.00 |
|||
|
Total |
GB£ 6,335.00 |
|||
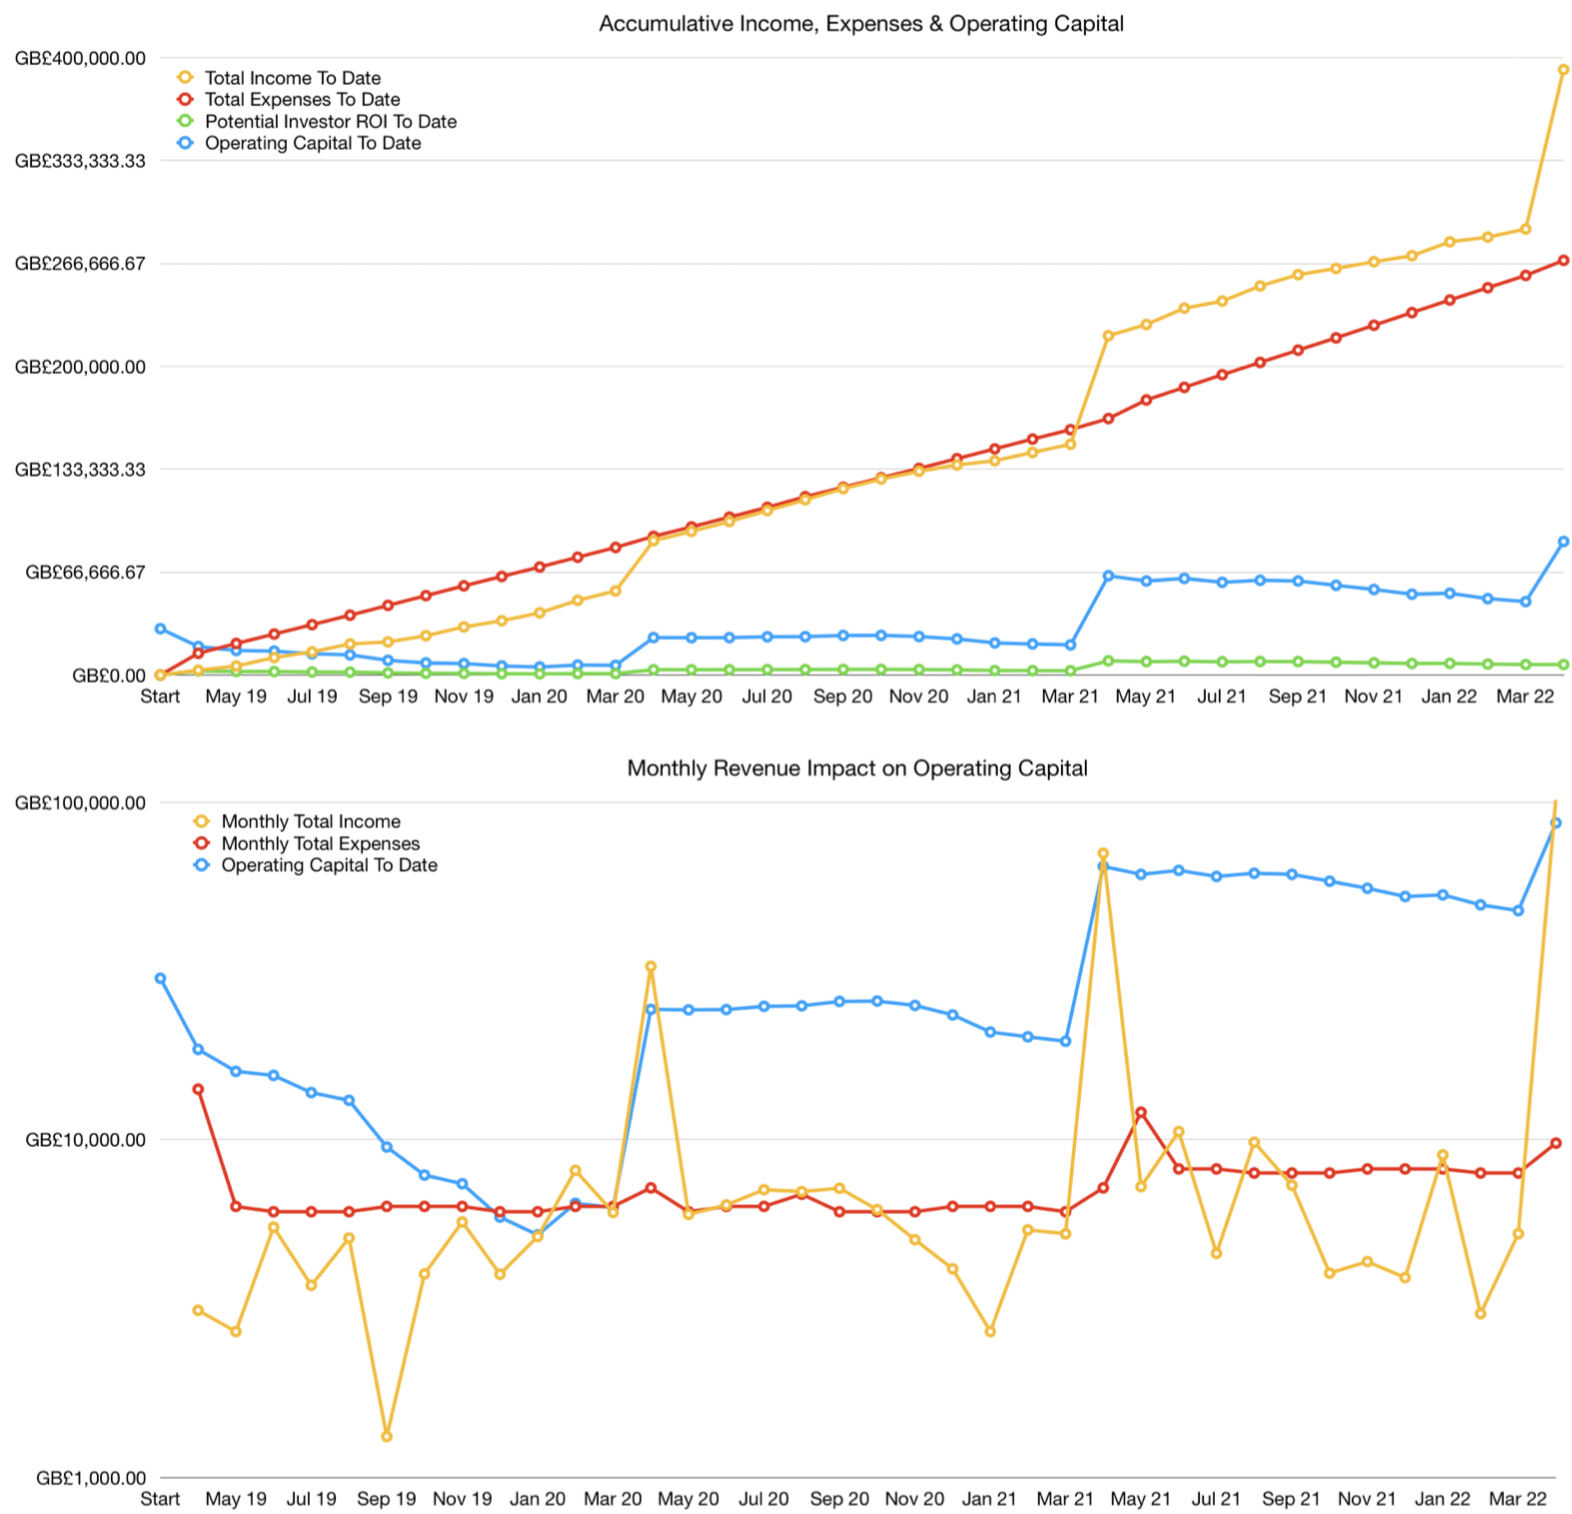
Increasing yearly workloads due to projected contract renewals may require recruiting a fourth member of staff at the start of the third year to maintain a stable workflow and uphold client obligations. This will increase monthly ongoing costs to just over £8000, and add an approximate cost of £25,000 to third year projections, accounted for in salary and equipment. These costs are projected in Appendix C: ‘Monthly Revenue Impact on Operating Capital’.
Projected Profit & Loss
Throughout each year for the first three years, monthly operational costs are expected to border on or even outmatch revenue for most months except April, when there is expected to be a significant increase in income due to contracts. This surge in the beginning of this financial year provides opportunity to re-invest in company growth and/or provide higher return to investors. The lowest monthly operating capital is projected at approx £6,500 towards the end of the first year, providing a safety net with which to handle unforeseen circumstances or manipulate advertising budgets to increase sales turnover. Yearly Income & Expenses figures are provided under Appendix D.
As shown in the graph below, the company will reach breakeven: the point where total income is greater than total expenses, in the beginning of its third year in operation: April 2021, and will remain profitable henceforth (Abu Sayed, 2019).
Scenario B - Low Demand
This scenario outlines the projected financial situation using the lowest expected sales figures as a result of poor market conditions. This takes into account required alterations to ongoing costs such as salary, rent and equipment after the first financial year so as to maintain profitability over the accounted timespan.
Investment Return
This scenario provides the lowest return rates, with the business projected to be self-sufficient towards the end of the third operational year. Figures provided in Appendix B indicate a return just over £4,515 (≈15%) on the original investment over the three year duration.
Initial & Ongoing Costs
As with the first scenario, initial costs will total £14,085, leaving the remaining capital to finance business operations till the start of the following financial year. After the first years rent contract expires, the company will relocate to slightly smaller offices in a less-central location, effecting both rent and utility costs. A minor one time cost of £450 may be encountered to appropriately furnish the new office space. A reduction in advertising budget and founder salaries is also to be implemented until well into profitability. The implemented changes are expected to reduce monthly operating costs by £1650, ensuring that the company is able to cover ongoing expenses, and eventually begin displaying growth trends.
|
Expense |
StartUp Costs |
Original Monthly Costs |
Down-Scaling Costs |
Scaled Down Monthly Costs |
Monthly Savings |
|
Office Rental |
— |
GB£ 410.00 |
— |
GB£ 360.00 |
GB£ 50.00 |
|
Utilities |
— |
GB£ 105.00 |
— |
GB£ 80.00 |
GB£ 25.00 |
|
Web Hosting |
— |
GB£ 35.00 |
— |
GB£ 35.00 |
GB£ 0.00 |
|
Insurance |
— |
GB£ 120.00 |
— |
GB£ 120.00 |
GB£ 0.00 |
|
Advertising |
— |
GB£ 225.00 |
— |
GB£ 150.00 |
GB£ 75.00 |
|
Avg Software License |
— |
GB£ 190.00 |
— |
GB£ 190.00 |
GB£ 0.00 |
|
Salaries |
— |
GB£ 5,250.00 |
— |
GB£ 3,750.00 |
GB£ 1,500.00 |
|
Furniture |
GB£ 2,200.00 |
— |
GB£ 450.00 |
— |
— |
|
Computers |
GB£ 3,100.00 |
— |
— |
— |
— |
|
Printers/Scanners |
GB£ 530.00 |
— |
— |
— |
— |
|
Cell Phones |
GB£ 1,920.00 |
— |
— |
— |
— |
|
Total |
GB£ 7,750.00 |
GB£ 6,335.00 |
GB£ 450.00 |
GB£ 4,685.00 |
GB£ 1,650.00 |
|
Initial Totals |
GB£ 14,085.00 |
|
|||
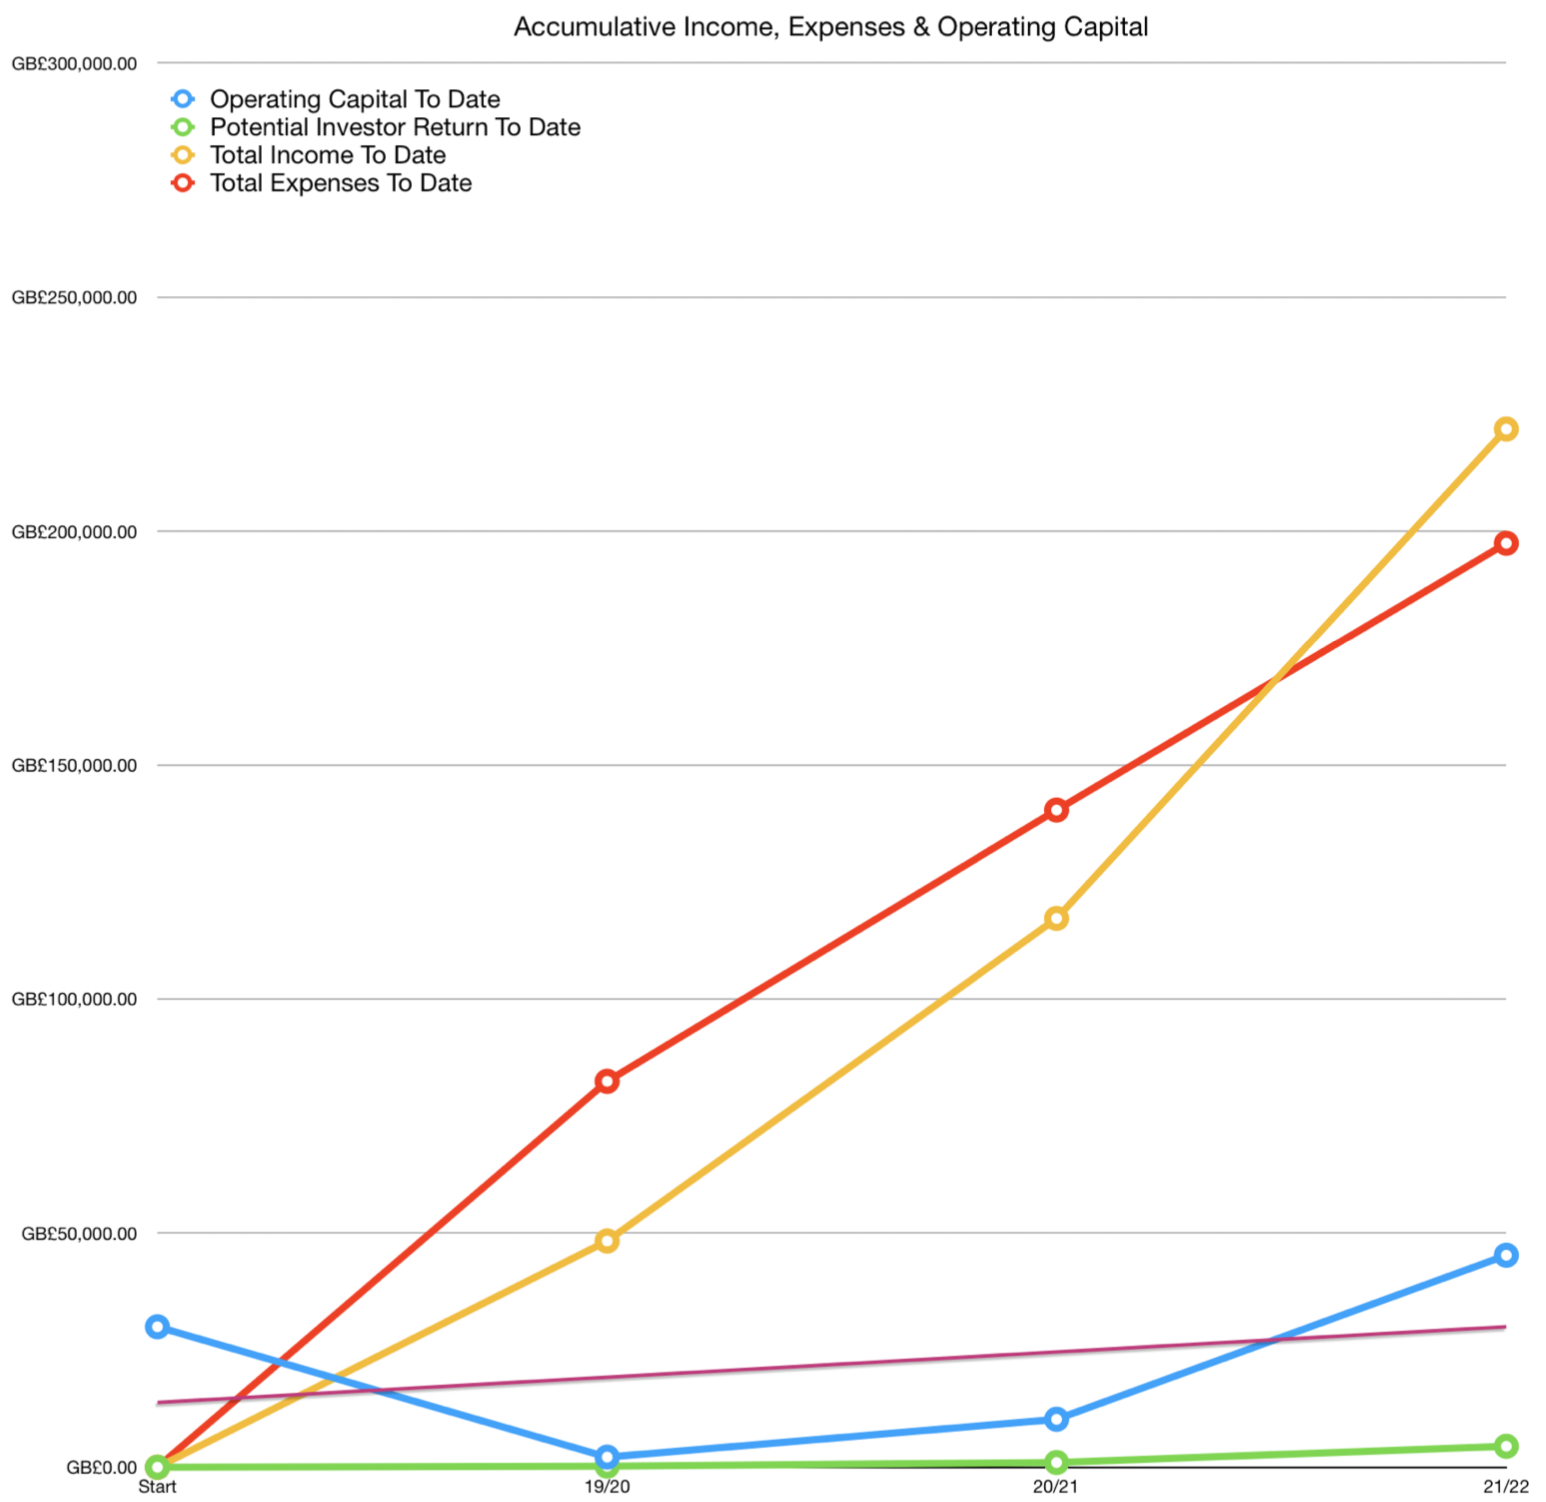
The circumstances governing this scenario assume low sales figures due to uncontrollably poor economic & market conditions. As a result, the business would be required to scale-down expenses after the first year to justify operating with lower than expected income and rapidly declining operating income. This is identifiable by the decreased expenses slope in the below graph following the first year. The sustainable break-even point is projected well into the third operational year.Projected Profit & Loss
Scenario C - Minimised Initial Expenses
In this alternative scenario, many initial costs are postponed until sustainable profitability is achieved, with the intention of utilising advancements such as cloud infrastructure to operate the business remotely whilst maintaining all necessary workflow communications. Although traditionally this drastic approach was considered unmanageable, a carefully planned technological execution will result in the highest predicted returns, whilst leaving a reasonable monetary fallback to flexibly re-strategise with regard to operations and growth management.
Investment Return
This projection indicates the highest investment return, with the business expected to be self sufficient in the beginning of the second year, although by a conservatively narrow margin. If this is not met, it will push profitability to the third year, at which point, revenue would have increased significantly. Figures provided in Appendix B indicate a return of slightly over £9520 (≈31.7%) on the original investment value over the three year duration.
Initial & Ongoing Costs
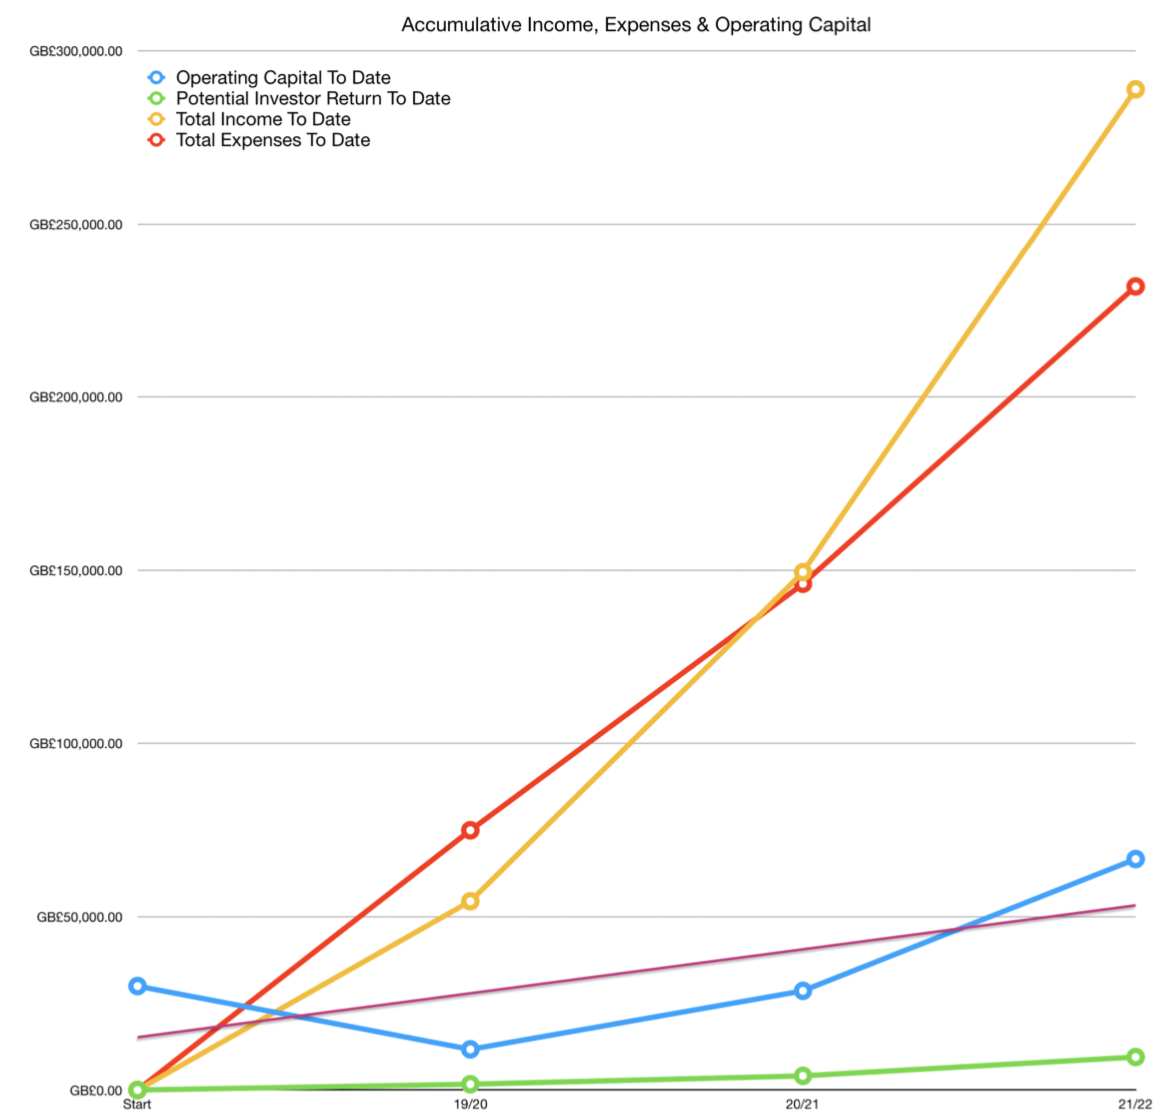
Both initial and monthly costs are minimised as a result of foregoing many traditional expenses including rent, utilities and furniture. Launching will require £10,945 upfront, and an additional £5,925 each additional month whilst not in office. The increased cost of software required to compensate for operational feasibility is insignificant compared to estimated rent and associated savings over the expected two year period. Once growth is established, centralising operations by moving into office space amounts to £11,350, and an additional £6,520 henceforth, accounting for a £595 monthly increase. This is clearly identifiable in Appendix C: ‘Monthly Revenue Impact on Operating Capital’.
|
Expense |
StartUp Costs |
Original Monthly Costs |
Office Move In Costs |
In Office Monthly Costs |
Monthly Cost Difference |
|
Office Rental |
— |
GB£ 0.00 |
— |
GB£ 410.00 |
GB£ 410.00 |
|
Utilities |
— |
GB£ 0.00 |
— |
GB£ 105.00 |
GB£ 105.00 |
|
Web Hosting |
— |
GB£ 35.00 |
— |
GB£ 35.00 |
GB£ 0.00 |
|
Insurance |
— |
GB£ 80.00 |
— |
GB£ 160.00 |
GB£ 80.00 |
|
Advertising |
— |
GB£ 290.00 |
— |
GB£ 290.00 |
GB£ 0.00 |
|
Avg Software License |
— |
GB£ 270.00 |
— |
GB£ 270.00 |
GB£ 0.00 |
|
Salaries |
— |
GB£ 5,250.00 |
— |
GB£ 5,250.00 |
GB£ 0.00 |
|
Furniture |
GB£ 0.00 |
— |
GB£ 2,750.00 |
— |
— |
|
Computers |
GB£ 3,100.00 |
— |
GB£ 1,550.00 |
— |
— |
|
Printers/Scanners |
GB£ 0.00 |
— |
GB£ 530.00 |
— |
— |
|
Cell Phones |
GB£ 1,920.00 |
— |
— |
— |
— |
|
Total |
GB£ 5,020.00 |
GB£ 5,925.00 |
GB£ 4,830.00 |
GB£ 6,520.00 |
GB£ 595.00 |
|
Initial Totals |
GB£ 10,945.00 |
GB£ 11,350.00 |
|||
Owing to the absence of a promotable office, a larger emphasis is placed on effectiveness of advertising to maintain brand recognition and resultantly expected sales results. A reduced investment in computer equipment is required upon start-up as the founders are willing to repurpose personal existing hardware for business purposes. Had the business leased offices from its inception, an additional expense of £19,110 [(£595 x 24 months) + £4,830] would have been incurred over the two year period.
Projected Profit & Loss
Throughout the first year, the company is expected to be recovering startup and ongoing costs, generating marginal profit in the beginning of the second financial year, as graphed in Appendix C: ‘Accumulative Income, Expenses & Operating Capital’. Although cumulative profits exceed expenses after the first financial year in April 2020, the margin between the variables remains narrow throughout the second year; hence sustainable breakeven remains projected for the following year in April 2021. The lowest monthly operating capital is projected at over £10,000, providing a comfortable safety net to deal with unforeseen circumstances and restructure out of office operations if necessary. Yearly Income & Expenses figures are provided under Appendix D.
Comparative Analysis
In both ‘Stable Growth’ and ‘Low Sales’, breakeven points will occur during the third financial year in April 2020, with the only impactful variation being the resulting revenue. The ‘Low Sales’ strategy and predictions serves as a satisfactory fallback solution if faced with unexpected market circumstances. Meanwhile under the ‘Minimised Initial Expense’ scenario, true breakeven is projected at just after the first operational year, however the margin between income and expenses is narrow causing sustainable breakeven to safely be predicted for the following year in April 2021. In all cases, the business is expected to be relying on investment capital to recover expenses throughout the first and possibly second financial years before breaking well into profits.
|
ROI |
Stable Growth |
Low Sales |
Minimised Initial Expense |
|
£ |
GB£ 6,563.83 |
GB£ 4,517.83 |
GB£ 9,523.41 |
|
% |
21.88% |
15.06% |
31.74% |
In all situations, a reasonable return is projected whilst ensuring that if the invested capital is withdrawn following the three year period, the company is capable of maintaining positive cashflow and financial stability by reserving a minimum of £15,000. This requirement is incorporated into the Appendix B: ‘End of Year ROI’ figures.
If the investor is concerned with long term risk, growth & success expectations, the ‘Stable Growth’ scenario represents the most appealing approach regardless of not possessing the highest rate of return. This is because long term business infrastructure is implemented from launch, minimising disruption by relying on tried and tested operational methods (Christian Nielsen; Morten Lund, 2018). Additionally, a comfortable monetary fallback is maintained throughout the first year of operations, allowing for circumstances such as those analysed in the ‘Low Sales’ scenario to occur without causing unsustainable operational capital throughout the first year.
On the contrary, ‘Minimised Initial Expenses’ is likely to appeal to investors interested in the highest returns, irrespective of perceived risks stemming from the large technological dependance required to conduct business operations and potential operations restructuring as a result of postponed investments. This scenario, although not necessarily the most ideal for establishing long term business strategy, appeals to investors who are concerned with identifying the most lucrative price, profitability, liquidity, debt and efficiency ratios across structured organisations within the same sector (Joe Lan, 2013). A number of single-variable graphed comparisons between the three scenarios is provided in Appendix E.
Conclusion
In the three scenarios, projections reflect a method of business scalability aimed at either accelerating returns or reducing expenses to ensure long-term profitable growth. Scalability aspects originate from the yearly expanding client-base and through the control of expenses in anticipation of or as a reaction to external market factors. As stipulated, all projections show a return of greater than £1,200, or 4% of the original investment value. Through this study of the possible financial outcomes, investors can be assured in the company’s ability to appropriately react and manipulate expenditure under a range of unpredictable market conditions, through means which ensures business profitability and satisfactory return on investment over a three year period.
References
Numbeo (2019). Cost of Living. Available at: https://www.numbeo.com/cost-of-living/in/Bath Accessed on April 1st, 2019
Christian Nielsen; Morten Lund (2018). Building Scalable Business Models
- MIT Slogan Management Review Magazine: Winter 2018 Issue - Research Feature - December 07, 2017 . Available at: https://sloanreview.mit.edu/article/building-scalable-business-models/ Accessed on April 4th, 2019
Abu Sayed (2019). Break-Even Point. Available at: https://www.academia.edu/11567832/Break-Even_Point Accessed on April 27th, 2019
Joe Lan (2013). 16 Financial Ratios for Analyzing a Company’s Strengths and Weaknesses. Available at: https://www.aaii.com/journal/article/16-financial-ratios-for-analyzing-a-companys-strengths-and-weaknesses Accessed on April 28th, 2019
Further Reading
Gumtree (2019). Bath BA1 Flexible - Modern - Private Office Space to Rent. Available at: https://www.gumtree.com/p/commercial-property-to-rent/-bath-ba1-flexible-modern-private-office-space-to-rent/1331499535 Accessed on April 1st, 2019
Anna Vital (2013). How Startup Funding Works – Infographic. Available at: https://blog.adioma.com/how-funding-works-splitting-equity-infographic/ Accessed on April 1st, 2019
Emily Coltman (2018). A small business guide to capital assets. Available at: https://smallbusiness.co.uk/a-small-business-guide-to-capital-assets-2465662/ Accessed on April 1st, 2019
Gordon Allinson; Paul Braidford; Maxine Houston; Ian Stone (2015). Understanding Growth in Small Businesses. Available at: https://assets.publishing.service.gov.uk/government/uploads/system/uploads/attachment_data/file/407846/bis-15-154-Understanding-growth-small-businesses.pdf Accessed on April 4th, 2019
Meredith Wood (2019). Break Even Analysis: What It Is and How to Calculate. Available at: https://www.fundera.com/blog/break-even-analysis Accessed on April 7th, 2019
Appendices
Appendix A: Product Prices
|
Product |
Initial |
Monthly |
Yearly |
|
New Website |
GB£ 1,200.00 |
— |
— |
|
Website Maintenance |
— |
GB£ 10.00 |
GB£ 120.00 |
|
New Commerce Website |
GB£ 1,600.00 |
— |
— |
|
Commerce Website Maintenance |
— |
GB£ 100.00 |
GB£ 1,200.00 |
|
New Networking |
GB£ 1,500.00 |
— |
— |
|
Networking Maintenance |
— |
GB£ 200.00 |
GB£ 2,400.00 |
|
General IT Support & Maintenance |
— |
GB£ 150.00 |
GB£ 1,800.00 |
|
IT Procurement |
GB£ 50.00 |
— |
— |
|
IT Security & Data Protection Service |
GB£ 500.00 |
GB£ 50.00 |
GB£ 600.00 |
Appendix B: Return On Investment
Scenario A - Stable Growth
|
|
19/20 |
20/21 |
21/22 |
Years Total |
|
Net Profit |
GB£ (28,165.00) |
GB£ 17,479.40 |
GB£ 38,476.51 |
GB£ 27,790.91 |
|
Investment |
GB£ 30,000.00 |
GB£ 0.00 |
GB£ 0.00 |
GB£ 30,000.00 |
|
Total Revenue Inc. Investment |
GB£ 1,835.00 |
GB£ 17,479.40 |
GB£ 38,476.51 |
GB£ 57,790.91 |
|
Income Tax Expense |
GB£ (5,351.35) |
GB£ 3,321.09 |
GB£ 7,310.54 |
GB£ 5,280.27 |
|
Net Revenue After Tax |
GB£ 7,186.35 |
GB£ 14,158.31 |
GB£ 31,165.97 |
GB£ 52,510.64 |
|
Net Revenue To Date |
GB£ 7,186.35 |
GB£ 21,344.66 |
GB£ 52,510.64 |
|
|
|
19/20 |
20/21 |
21/22 |
Years Total |
|
Potential Investor Return |
GB£ 898.29 |
GB£ 1,769.79 |
GB£ 3,895.75 |
GB£ 6,563.83 |
|
Potential Investor Return To Date |
GB£ 898.29 |
GB£ 2,668.08 |
GB£ 6,563.83 |
|
|
ROI % |
2.99% |
5.90% |
12.99% |
21.88% |
|
Operating Capital After Investor Return |
GB£ 6,288.06 |
GB£ 12,388.52 |
GB£ 27,270.23 |
GB£ 45,946.81 |
|
Operating Capital To Date |
GB£ 6,288.06 |
GB£ 18,676.58 |
GB£ 45,946.81 |
|
|
Return Initial Investment |
|
|
|
GB£ 30,000.00 |
|
Operating Capital After Investor Withdrawal |
|
|
|
GB£ 15,946.81 |
Scenario B - Low Demand
|
|
19/20 |
20/21 |
21/22 |
Years Total |
|
Net Profit |
GB£ (35,610.00) |
GB£ 12,299.40 |
GB£ 48,246.51 |
GB£ 24,935.91 |
|
Investment |
GB£ 30,000.00 |
GB£ 0.00 |
GB£ 0.00 |
GB£ 30,000.00 |
|
Total Revenue Inc. Investment |
GB£ (5,610.00) |
GB£ 12,299.40 |
GB£ 48,246.51 |
GB£ 54,935.91 |
|
Income Tax Expense |
GB£ (6,765.90) |
GB£ 2,336.89 |
GB£ 9,166.84 |
GB£ 4,737.82 |
|
Net Revenue After Tax |
GB£ 1,155.90 |
GB£ 9,962.51 |
GB£ 39,079.67 |
GB£ 50,198.09 |
|
Net Revenue To Date |
GB£ 1,155.90 |
GB£ 11,118.41 |
GB£ 50,198.09 |
|
|
|
19/20 |
20/21 |
21/22 |
Years Total |
|
Potential Investor Return |
GB£ 104.03 |
GB£ 896.63 |
GB£ 3,517.17 |
GB£ 4,517.83 |
|
Potential Investor Return To Date |
GB£ 104.03 |
GB£ 1,000.66 |
GB£ 4,517.83 |
|
|
ROI % |
0.35% |
2.99% |
11.72% |
15.06% |
|
Operating Capital After Investor Return |
GB£ 1,051.87 |
GB£ 9,065.89 |
GB£ 35,562.50 |
GB£ 45,680.26 |
|
Operating Capital To Date |
GB£ 1,051.87 |
GB£ 10,117.76 |
GB£ 45,680.26 |
|
|
Return Initial Investment |
|
|
|
GB£ 30,000.00 |
|
Operating Capital After Investor Withdrawal |
|
|
|
GB£ 15,680.26 |
Scenario C - Minimised Initial Expenses
|
|
19/20 |
20/21 |
21/22 |
Years Total |
|
Net Profit |
GB£ (20,480.00) |
GB£ 23,836.00 |
GB£ 53,665.32 |
GB£ 57,021.32 |
|
Investment |
GB£ 30,000.00 |
GB£ 0.00 |
GB£ 0.00 |
GB£ 30,000.00 |
|
Total Revenue Inc. Investment |
GB£ 9,520.00 |
GB£ 23,836.00 |
GB£ 53,665.32 |
GB£ 87,021.32 |
|
Income Tax Expense |
GB£ (3,891.20) |
GB£ 4,528.84 |
GB£ 10,196.41 |
GB£ 10,834.05 |
|
Net Revenue After Tax |
GB£ 13,411.20 |
GB£ 19,307.16 |
GB£ 43,468.91 |
GB£ 76,187.27 |
|
Net Revenue To Date |
GB£ 13,411.20 |
GB£ 32,718.36 |
GB£ 76,187.27 |
|
|
|
19/20 |
20/21 |
21/22 |
Years Total |
|
Potential Investor Return |
GB£ 1,676.40 |
GB£ 2,413.40 |
GB£ 5,433.61 |
GB£ 9,523.41 |
|
Potential Investor Return To Date |
GB£ 1,676.40 |
GB£ 4,089.80 |
GB£ 9,523.41 |
|
|
ROI % |
5.59% |
8.04% |
18.11% |
31.74% |
|
Operating Capital After Investor Return |
GB£ 11,734.80 |
GB£ 16,893.77 |
GB£ 38,035.30 |
GB£ 66,663.86 |
|
Operating Capital To Date |
GB£ 11,734.80 |
GB£ 28,628.57 |
GB£ 66,663.86 |
|
|
Return Initial Investment |
|
|
|
GB£ 30,000.00 |
|
Operating Capital After Investor Withdrawal |
|
|
|
GB£ 36,663.86 |
Appendix C: Projected Income & Expenses Graphs
Scenario A - Stable Growth
Scenario B - Low Demand
Scenario C - Minimised Initial Expenses
Appendix D: Yearly Income & Expenses Figures
Scenario A - Stable Growth
|
|
19/20 |
20/21 |
21/22 |
Years Total |
|
New Website |
GB£ 15,600.00 |
GB£ 10,800.00 |
GB£ 16,800.00 |
GB£ 43,200.00 |
|
Website Maintenance |
GB£ 580.00 |
GB£ 1,580.00 |
GB£ 2,360.00 |
GB£ 4,520.00 |
|
New Commerce Website |
GB£ 16,000.00 |
GB£ 19,200.00 |
GB£ 19,200.00 |
GB£ 54,400.00 |
|
Commerce Website Maintenance |
GB£ 4,700.00 |
GB£ 16,500.00 |
GB£ 24,900.00 |
GB£ 46,100.00 |
|
New Networking |
GB£ 7,500.00 |
GB£ 9,000.00 |
GB£ 9,000.00 |
GB£ 25,500.00 |
|
Networking Maintenance |
GB£ 200.00 |
GB£ 8,200.00 |
GB£ 17,800.00 |
GB£ 26,200.00 |
|
General IT Support & Maintenance |
GB£ 4,950.00 |
GB£ 19,350.00 |
GB£ 33,450.00 |
GB£ 57,750.00 |
|
IT Procurement |
GB£ 850.00 |
GB£ 700.00 |
GB£ 1,200.00 |
GB£ 2,750.00 |
|
IT Security & Data Protection Service |
GB£ 4,100.00 |
GB£ 9,650.00 |
GB£ 14,750.00 |
GB£ 28,500.00 |
|
Yearly Total Income |
GB£ 54,480.00 |
GB£ 94,980.00 |
GB£ 139,460.00 |
GB£ 288,920.00 |
|
Total Income To Date |
GB£ 54,480.00 |
GB£ 149,460.00 |
GB£ 288,920.00 |
|
|
|
19/20 |
20/21 |
21/22 |
Years Total |
|
Office Rental |
GB£ 4,920.00 |
GB£ 4,920.00 |
GB£ 4,920.00 |
GB£ 14,760.00 |
|
Utilities |
GB£ 1,260.00 |
GB£ 1,260.00 |
GB£ 1,260.00 |
GB£ 3,780.00 |
|
Web Hosting |
GB£ 420.00 |
GB£ 420.00 |
GB£ 420.00 |
GB£ 1,260.00 |
|
Insurance |
GB£ 1,440.00 |
GB£ 1,440.00 |
GB£ 1,440.00 |
GB£ 4,320.00 |
|
Advertising |
GB£ 1,575.00 |
GB£ 1,350.00 |
GB£ 1,125.00 |
GB£ 4,050.00 |
|
Furniture |
GB£ 2,200.00 |
GB£ 550.00 |
GB£ 1,100.00 |
GB£ 3,850.00 |
|
Computers |
GB£ 3,100.00 |
GB£ 0.00 |
GB£ 1,550.00 |
GB£ 4,650.00 |
|
Printers/Scanners |
GB£ 530.00 |
GB£ 360.00 |
GB£ 860.00 |
GB£ 1,750.00 |
|
Software Licensing |
GB£ 2,280.00 |
GB£ 2,280.00 |
GB£ 3,325.00 |
GB£ 7,885.00 |
|
Salaries |
GB£ 63,000.00 |
GB£ 63,000.00 |
GB£ 82,250.00 |
GB£ 208,250.00 |
|
Cell Phones |
GB£ 1,920.00 |
GB£ 720.00 |
GB£ 1,650.00 |
GB£ 4,290.00 |
|
Depreciation |
GB£ 0.00 |
GB£ 1,200.60 |
GB£ 1,083.49 |
GB£ 2,284.09 |
|
Yearly Total Expenses |
GB£ 82,645.00 |
GB£ 77,500.60 |
GB£ 100,983.49 |
GB£ 261,129.09 |
|
Total Expenses To Date |
GB£ 82,645.00 |
GB£ 160,145.60 |
GB£ 261,129.09 |
|
Scenario B - Low Demand
|
|
19/20 |
20/21 |
21/22 |
Years Total |
|
New Website |
GB£ 12,000.00 |
GB£ 7,200.00 |
GB£ 7,200.00 |
GB£ 26,400.00 |
|
Website Maintenance |
GB£ 410.00 |
GB£ 1,180.00 |
GB£ 1,860.00 |
GB£ 3,450.00 |
|
New Commerce Website |
GB£ 11,200.00 |
GB£ 11,200.00 |
GB£ 14,400.00 |
GB£ 36,800.00 |
|
Commerce Website Maintenance |
GB£ 3,800.00 |
GB£ 11,300.00 |
GB£ 18,600.00 |
GB£ 33,700.00 |
|
New Networking |
GB£ 7,500.00 |
GB£ 7,500.00 |
GB£ 9,000.00 |
GB£ 24,000.00 |
|
Networking Maintenance |
GB£ 2,400.00 |
GB£ 12,200.00 |
GB£ 22,600.00 |
GB£ 37,200.00 |
|
General IT Support & Maintenance |
GB£ 4,800.00 |
GB£ 13,500.00 |
GB£ 21,000.00 |
GB£ 39,300.00 |
|
IT Procurement |
GB£ 600.00 |
GB£ 550.00 |
GB£ 800.00 |
GB£ 1,950.00 |
|
IT Security & Data Protection Service |
GB£ 4,100.00 |
GB£ 5,600.00 |
GB£ 9,850.00 |
GB£ 19,550.00 |
|
Yearly Total Income |
GB£ 46,810.00 |
GB£ 70,230.00 |
GB£ 105,310.00 |
GB£ 222,350.00 |
|
Total Income To Date |
GB£ 46,810.00 |
GB£ 117,040.00 |
GB£ 222,350.00 |
|
|
|
19/20 |
20/21 |
21/22 |
Years Total |
|
Office Rental |
GB£ 4,920.00 |
GB£ 4,320.00 |
GB£ 4,320.00 |
GB£ 13,560.00 |
|
Utilities |
GB£ 1,260.00 |
GB£ 960.00 |
GB£ 960.00 |
GB£ 3,180.00 |
|
Web Hosting |
GB£ 420.00 |
GB£ 420.00 |
GB£ 420.00 |
GB£ 1,260.00 |
|
Insurance |
GB£ 1,440.00 |
GB£ 1,440.00 |
GB£ 1,440.00 |
GB£ 4,320.00 |
|
Advertising |
GB£ 1,350.00 |
GB£ 900.00 |
GB£ 600.00 |
GB£ 2,850.00 |
|
Furniture |
GB£ 2,200.00 |
GB£ 450.00 |
GB£ 0.00 |
GB£ 2,650.00 |
|
Computers |
GB£ 3,100.00 |
GB£ 0.00 |
GB£ 0.00 |
GB£ 3,100.00 |
|
Printers/Scanners |
GB£ 530.00 |
GB£ 360.00 |
GB£ 360.00 |
GB£ 1,250.00 |
|
Software Licensing |
GB£ 2,280.00 |
GB£ 2,280.00 |
GB£ 2,280.00 |
GB£ 6,840.00 |
|
Salaries |
GB£ 63,000.00 |
GB£ 45,000.00 |
GB£ 45,000.00 |
GB£ 153,000.00 |
|
Cell Phones |
GB£ 1,920.00 |
GB£ 600.00 |
GB£ 600.00 |
GB£ 3,120.00 |
|
Depreciation |
GB£ 0.00 |
GB£ 1,200.60 |
GB£ 1,083.49 |
GB£ 2,284.09 |
|
Yearly Total Expenses |
GB£ 82,420.00 |
GB£ 57,930.60 |
GB£ 57,063.49 |
GB£ 197,414.09 |
|
Total Expenses To Date |
GB£ 82,420.00 |
GB£ 140,350.60 |
GB£ 197,414.09 |
|
Scenario C - Minimised Initial Expenses
|
|
19/20 |
20/21 |
21/22 |
Years Total |
|
New Website |
GB£ 15,600.00 |
GB£ 10,800.00 |
GB£ 16,800.00 |
GB£ 43,200.00 |
|
Website Maintenance |
GB£ 580.00 |
GB£ 1,580.00 |
GB£ 2,360.00 |
GB£ 4,520.00 |
|
New Commerce Website |
GB£ 16,000.00 |
GB£ 19,200.00 |
GB£ 19,200.00 |
GB£ 54,400.00 |
|
Commerce Website Maintenance |
GB£ 4,700.00 |
GB£ 16,500.00 |
GB£ 24,900.00 |
GB£ 46,100.00 |
|
New Networking |
GB£ 7,500.00 |
GB£ 9,000.00 |
GB£ 9,000.00 |
GB£ 25,500.00 |
|
Networking Maintenance |
GB£ 200.00 |
GB£ 8,200.00 |
GB£ 17,800.00 |
GB£ 26,200.00 |
|
General IT Support & Maintenance |
GB£ 4,950.00 |
GB£ 19,350.00 |
GB£ 33,450.00 |
GB£ 57,750.00 |
|
IT Procurement |
GB£ 850.00 |
GB£ 700.00 |
GB£ 1,200.00 |
GB£ 2,750.00 |
|
IT Security & Data Protection Service |
GB£ 4,100.00 |
GB£ 9,650.00 |
GB£ 14,750.00 |
GB£ 28,500.00 |
|
Yearly Total Income |
GB£ 54,480.00 |
GB£ 94,980.00 |
GB£ 139,460.00 |
GB£ 288,920.00 |
|
Total Income To Date |
GB£ 54,480.00 |
GB£ 149,460.00 |
GB£ 288,920.00 |
|
|
|
19/20 |
20/21 |
21/22 |
Years Total |
|
Office Rental |
GB£ 0.00 |
GB£ 0.00 |
GB£ 4,920.00 |
GB£ 4,920.00 |
|
Utilities |
GB£ 0.00 |
GB£ 0.00 |
GB£ 1,260.00 |
GB£ 1,260.00 |
|
Web Hosting |
GB£ 420.00 |
GB£ 420.00 |
GB£ 420.00 |
GB£ 1,260.00 |
|
Insurance |
GB£ 960.00 |
GB£ 960.00 |
GB£ 1,920.00 |
GB£ 3,840.00 |
|
Advertising |
GB£ 2,320.00 |
GB£ 2,030.00 |
GB£ 1,740.00 |
GB£ 6,090.00 |
|
Furniture |
GB£ 0.00 |
GB£ 0.00 |
GB£ 2,750.00 |
GB£ 2,750.00 |
|
Computers |
GB£ 3,100.00 |
GB£ 0.00 |
GB£ 1,550.00 |
GB£ 4,650.00 |
|
Printers/Scanners |
GB£ 0.00 |
GB£ 0.00 |
GB£ 1,060.00 |
GB£ 1,060.00 |
|
Software Licensing |
GB£ 3,240.00 |
GB£ 3,240.00 |
GB£ 4,860.00 |
GB£ 11,340.00 |
|
Salaries |
GB£ 63,000.00 |
GB£ 63,000.00 |
GB£ 63,000.00 |
GB£ 189,000.00 |
|
Cell Phones |
GB£ 1,920.00 |
GB£ 720.00 |
GB£ 1,680.00 |
GB£ 4,320.00 |
|
Depreciation |
GB£ 0.00 |
GB£ 774.00 |
GB£ 634.68 |
GB£ 1,408.68 |
|
Yearly Total Expenses |
GB£ 74,960.00 |
GB£ 71,144.00 |
GB£ 85,794.68 |
GB£ 231,898.68 |
|
Total Expenses To Date |
GB£ 74,960.00 |
GB£ 146,104.00 |
GB£ 231,898.68 |
|
Appendix E: Comparative Scenario Graphs
Ratings